Field Elementary (2017)
School Information
- School District: Jefferson County Public Schools
- School Address: 120 Sacred Heart Lane , Louisville, KY 40206, US
- School Phone: 502-485-8252
- School Fax: 502-313-3459
- Principal: Deborah Rivera
- Contact E-Mail: deborah.rivera@jefferson.kyschools.us
- Web Address: http://www.jefferson.k12.ky.us/Schools/Elementary/Field/index.html
Demographics
- Number of Students: 417
- Percent Eligible for Free and Reduced Lunch: 62.6%
- Percent of Limited English Proficient: 3%
- Percent of Special Education: 16.8%
Racial/Ethnic Percentages:
- White: 54%
- Black: 29.3%
- Hispanic: 4.2%
- Asian: 7.2%
- Native Hawaiian or Other Pacific Islander: 0.5%
- American Indian or Alaska Native: 0%
- Multiracial: 4.8%
- Other: 0%
Field Elementarty participated as a PLC pilot school working with Solution Tree and the DuFours starting in 2012. As part of this process Field received an initial training and follow up conference calls with Rick and Becky DuFour and school site visits/on site visits with Solution Tree. Building PLCs at Field was a three year process starting with full staff training, writing shared mission/vision statements, writing SMART goals, developing a deep understanding of the four essential questions of a PLC, team norm building, developing skills in data analysis, and building resources around WIN time for all students. Our three year PLC pilot cycle at the end of the 2015 school year and we are proud to say that Field staff continue to function as a high level PLC. PLCs are not what we do - but what we are.
At Field Elementary, we understand the importance of adult collaboration to collectively meet the needs of our very diverse student population. We have worked hard to develop a school culture where all students are "our" students. That joint ownership and responsibility were instilled in us because of our initial training with Rick and Becky DuFour. We understand and continue to push to improve our collective ownership and responsibilty for the academic success of all of our students. Being a PLC has forced us to tackle hard topics and difficult students with a growth mindset. We strive every day to meet the needs of all of our students.
1. Monitoring student learning on a timely basis.
Grade level teams meet weekly in "What I Need" teacher planning groups to answer the four essential questions of a PLC.
- What do we want our student to know and be able to do?
- How will we know when each student has learned?
- How will we respond to students that have not learned?
- How will we respond when students do learn?
They write common assessments (formative) frequently to monitor student learning on each essential skill and concept. Students are placed in standards- based What I Need groups based on their strengths and weaknesses for each essential standard. The grade level teams utilize the action plan worksheet (attached in the resource section) to monitor intentional student interventions and methods of early identification for struggling students. Team-developed common assessments are monitored and adjusted for quality by ensuring that directions are easy to understand, learning targets are listed on the assessment, students have enough time for completion, tasks are varied (m.c, short answer), calculator use is/is not appropriate, and scoring rubrics are stated for each item. In addtion, to common formative assessments, Field students take district benchmark assessments. These assessments are administered quarterly. Teachers then review the data from these district proficiencies to determine if we have met our SMART goals. If SMART goals have not been met, we use this data to form WIN groups to assure mastery of learning.
2. Creating systems of intervention to provide students with additional time and support for learning.
School resources have been allocated to WIN (What I Need) time to ensure that all students in the school, at every grade level receive daily standards based intervention and/or enrichment, in addition to - not in place of - new instruction. WIN time is scheduled on a staggered basis by grade level to ensure that each grade level is "flooded" with adults for one hour per day so that multiple WIN groups can be served.
WIN planning time is provided in the master schedule (in addition to regular planning time) with each grade level being provided one hour/four days per week and 90 minutes ine day per week. In addition, after school faculty meeting time is often allocated for PLC meetings. WIN planning time focuses on determining essential skills, creating common assessments on essential skills, data analysis, WIN group planning, writing SMART goals, and reviewing team norms. WIN groups meet weekly and include all members of the WIN team for the grade level. Members of the WIN team are classroom teachers, retired teachers, instructional assistants, the school goal clarity coach, and school administrators.
3. Building teacher capacity to work as members of high performing collaborative teams that focus efforts on improved learning for all students.
Collaborative teams developed understanding and implementation of work that furthers the development of high quality common unit by unit assessments. Teachers are clear on exactly what students must know and be able to do and use formative assessment response protocols and common unit assessments to plan instruction, interventions, and enrichment based on the information obtained. They develop team norms and create a specific team plan of action for students who are struggling to learn an essential skill/concept.
Additional Achievement Data
Prior to starting its work as a PLC, Field placed in the 13th percentile of elementary schools in Kentucky. After three years as a PLC pilot school, Field incresed to the 95 percentile of all elementary schools in Kentucky.
2016-2017 State KPREP Data
Ranking: 5th out of 95 Jefferson County Elementary Schools (KY)
Because we are a PLC school, we were able to differentiate our instruction last year to truly meet the needs of our students – student by student and skill by skill. As these chart demonstrate, we not only significantly reduced the number of students performing well below grade level, we were able to increase the number of students performing at or above grade level.
Reduction of Students Performing Significantly Below Grade Level
|
Testing Year |
Reading |
Math |
Writing |
Writing |
|
|
% below grade level |
% below grade level |
% below grade level |
% below grade level |
|
2015-2016 |
19.7% |
11.5% |
9.5% |
9.5% |
|
2016-2017 |
12.2% |
6.4% |
1.6% |
1.6% |
Increase of Students Performing at or above Grade Level
|
|
Reading |
Math |
Writing |
|
|
% at or above grade level |
% at or above grade level |
% at or above grade level |
|
2015-2016 |
60.6% |
68.8% |
55.4% |
|
2016-2017 |
66.0% |
71.3% |
63.9% |
Students with a Disability-School to State
Percent Below Grade Level
|
|
Reading |
|
Math |
|
Writing |
|
|
|
Field |
State |
Field |
State |
Field |
State |
|
2016-2017 |
10.6% |
39.5% |
6.4% |
33.9% |
0.0% |
47.0% |
2012-2013
78% of all elementary schools in the state
|
Content Area |
Field % Proficient |
State % Proficient |
|
Reading |
62 |
47.8 |
|
Math |
59 |
43.9 |
|
Social Studies |
44.3 |
59.3 |
|
Writing |
37.7 |
35.7 |
|
Language Mechanics |
69.9 |
53.7
|
Reading - Field 3rd graders at or above level 72.7% - State 47.6%
Reading - Field 4th graders at or above level 68.5% - State 48.8%
Reading - Field 5th graders at or above level 42.6% - State 47.1%
Math - Field 3rd graders at or above level 69.7% - State 43.5%
Math - Field 4th graders at or above level 58.9 - State 43.9
Math - Field 5th graders at or above level 47.5 - State 44.3
2013-2014 State KPREP Data
93% of all elmentary schools in the state
|
Content Area |
Field % Proficient |
State % Proficient |
|
Reading |
68.1 |
54.7 |
|
Math |
66.8 |
49.2 |
|
Social Studies |
64.9 |
58.2 |
|
Writing |
73.0 |
38.7 |
|
Language Mechanics |
62.2 |
51.8
|
Reading - Field 3rd graders at or above level 69.2% - State 54.1%
Reading - Field 4th graders at or above level 71.6% - State 54.0%
Reading Field 5th graders at or above level 63.5% - State 55.9%
Math - Field 3rd grades at or above level 66.7% - State 45.8%
Math - Field 4th graders at or above level 70.3% - State 49.0%
Math - Field 5th graders at or above level 63.5 - State 52.7
2015-2016 State KPREP Data
95% of all elementary schools in the state
Reading - Field 3rd graders at or above level 61.4% - State 54.3%
Reading - Field 4th graders at or above level 74.0% - State 52.2%
Reading Field 5th graders at or above level 64.2% - State 56.0%
Math - Field 3rd grades at or above level 57.1% - State 47.6%
Math - Field 4th graders at or above level 67.1% - State 48.6%
Math - Field 5th graders at or above level 67.2% - State 50.3%
|
Content Area |
Field % Proficient |
State % Proficient |
||||||||||||||||||
|
Reading |
66.7 |
54.2 |
||||||||||||||||||
|
Math |
63.8 |
48.8 |
||||||||||||||||||
|
Social Studies |
70.1 |
60.6 |
||||||||||||||||||
|
Writing |
61.2 |
43.8 |
||||||||||||||||||
|
Language Mechanics
|
68.2 |
55.6
|
|
|
|
|
|
|
|
|
|
|
|
|
|
|
|
|
|
|
|
|
|
|
|
|
|
|
|
|
|
|
|
|
|
|
|
|
|
|
|
|
|
|
|
|
|
|
|
|
|
|
|
|
||||||||||||||||||
|
|
|
|
||||||||||||||||||
|
|
|
|
||||||||||||||||||
|
|
|
|
||||||||||||||||||
|
|
|
|
||||||||||||||||||
|
|
|
|
2016 State Distinguished School
2015 State School of Distinction (top 5%)
2015 State Teacher of the Year
2014 State Distinguised and HIgh Progress School
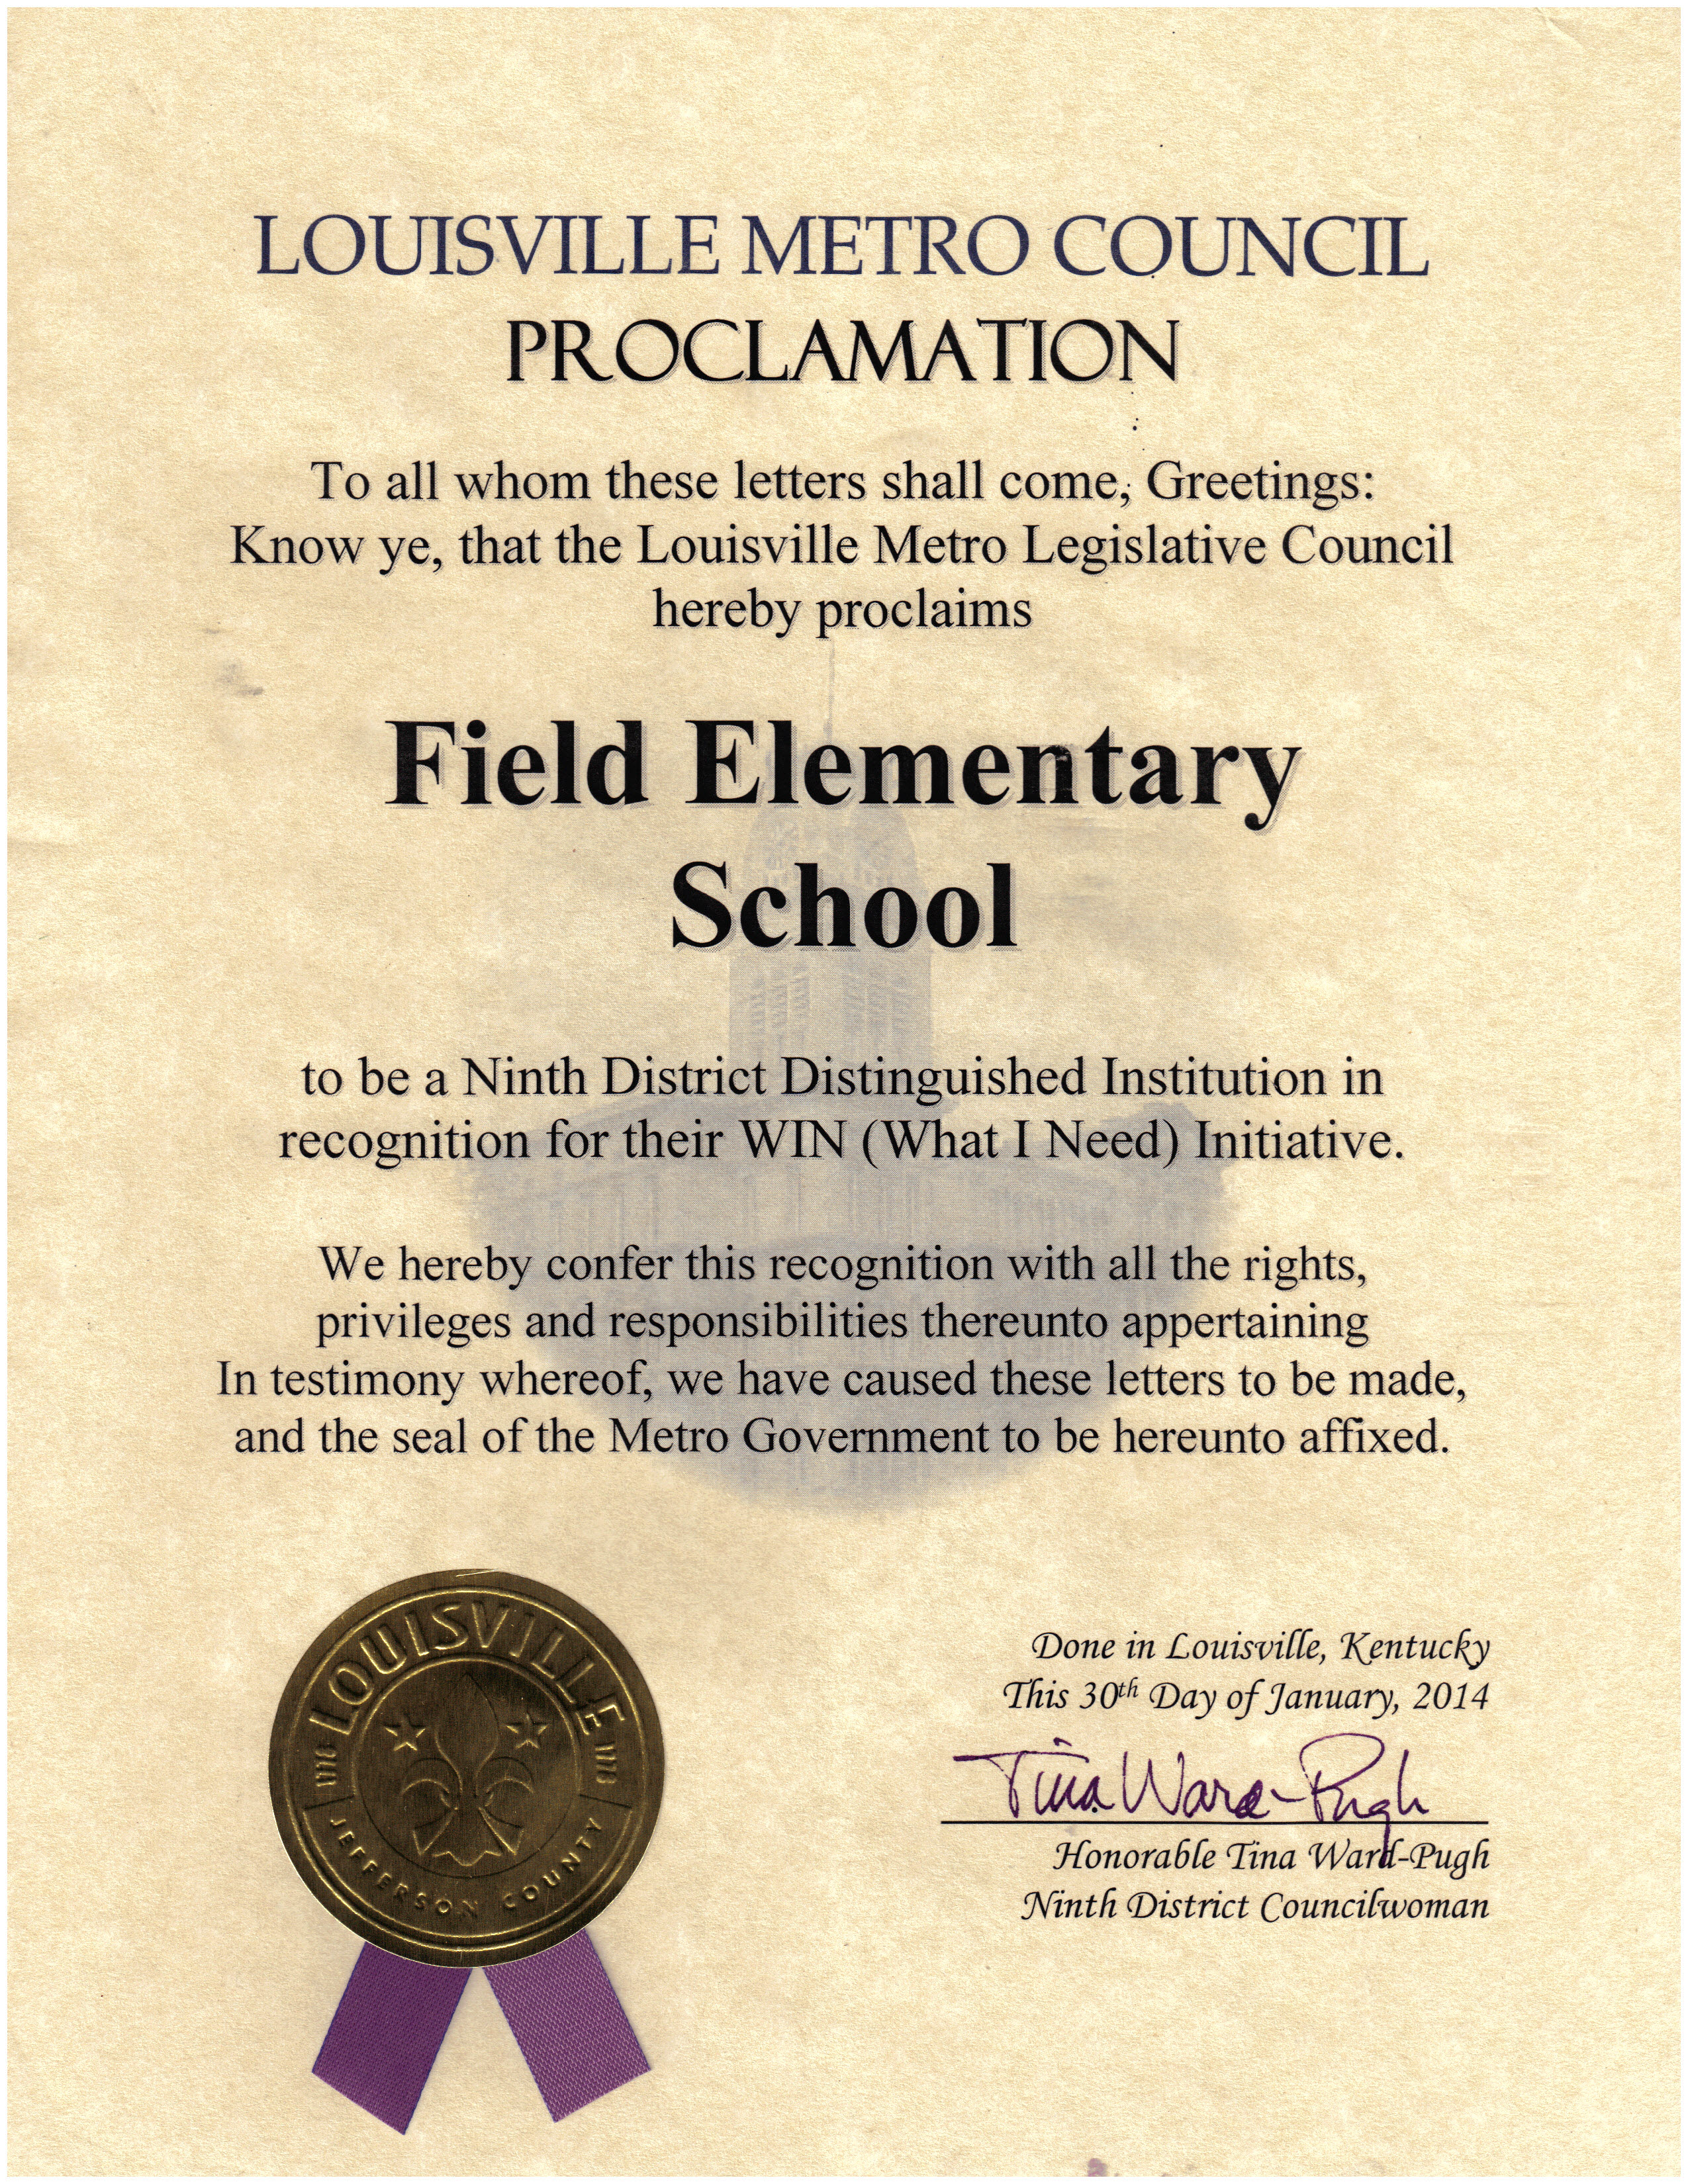
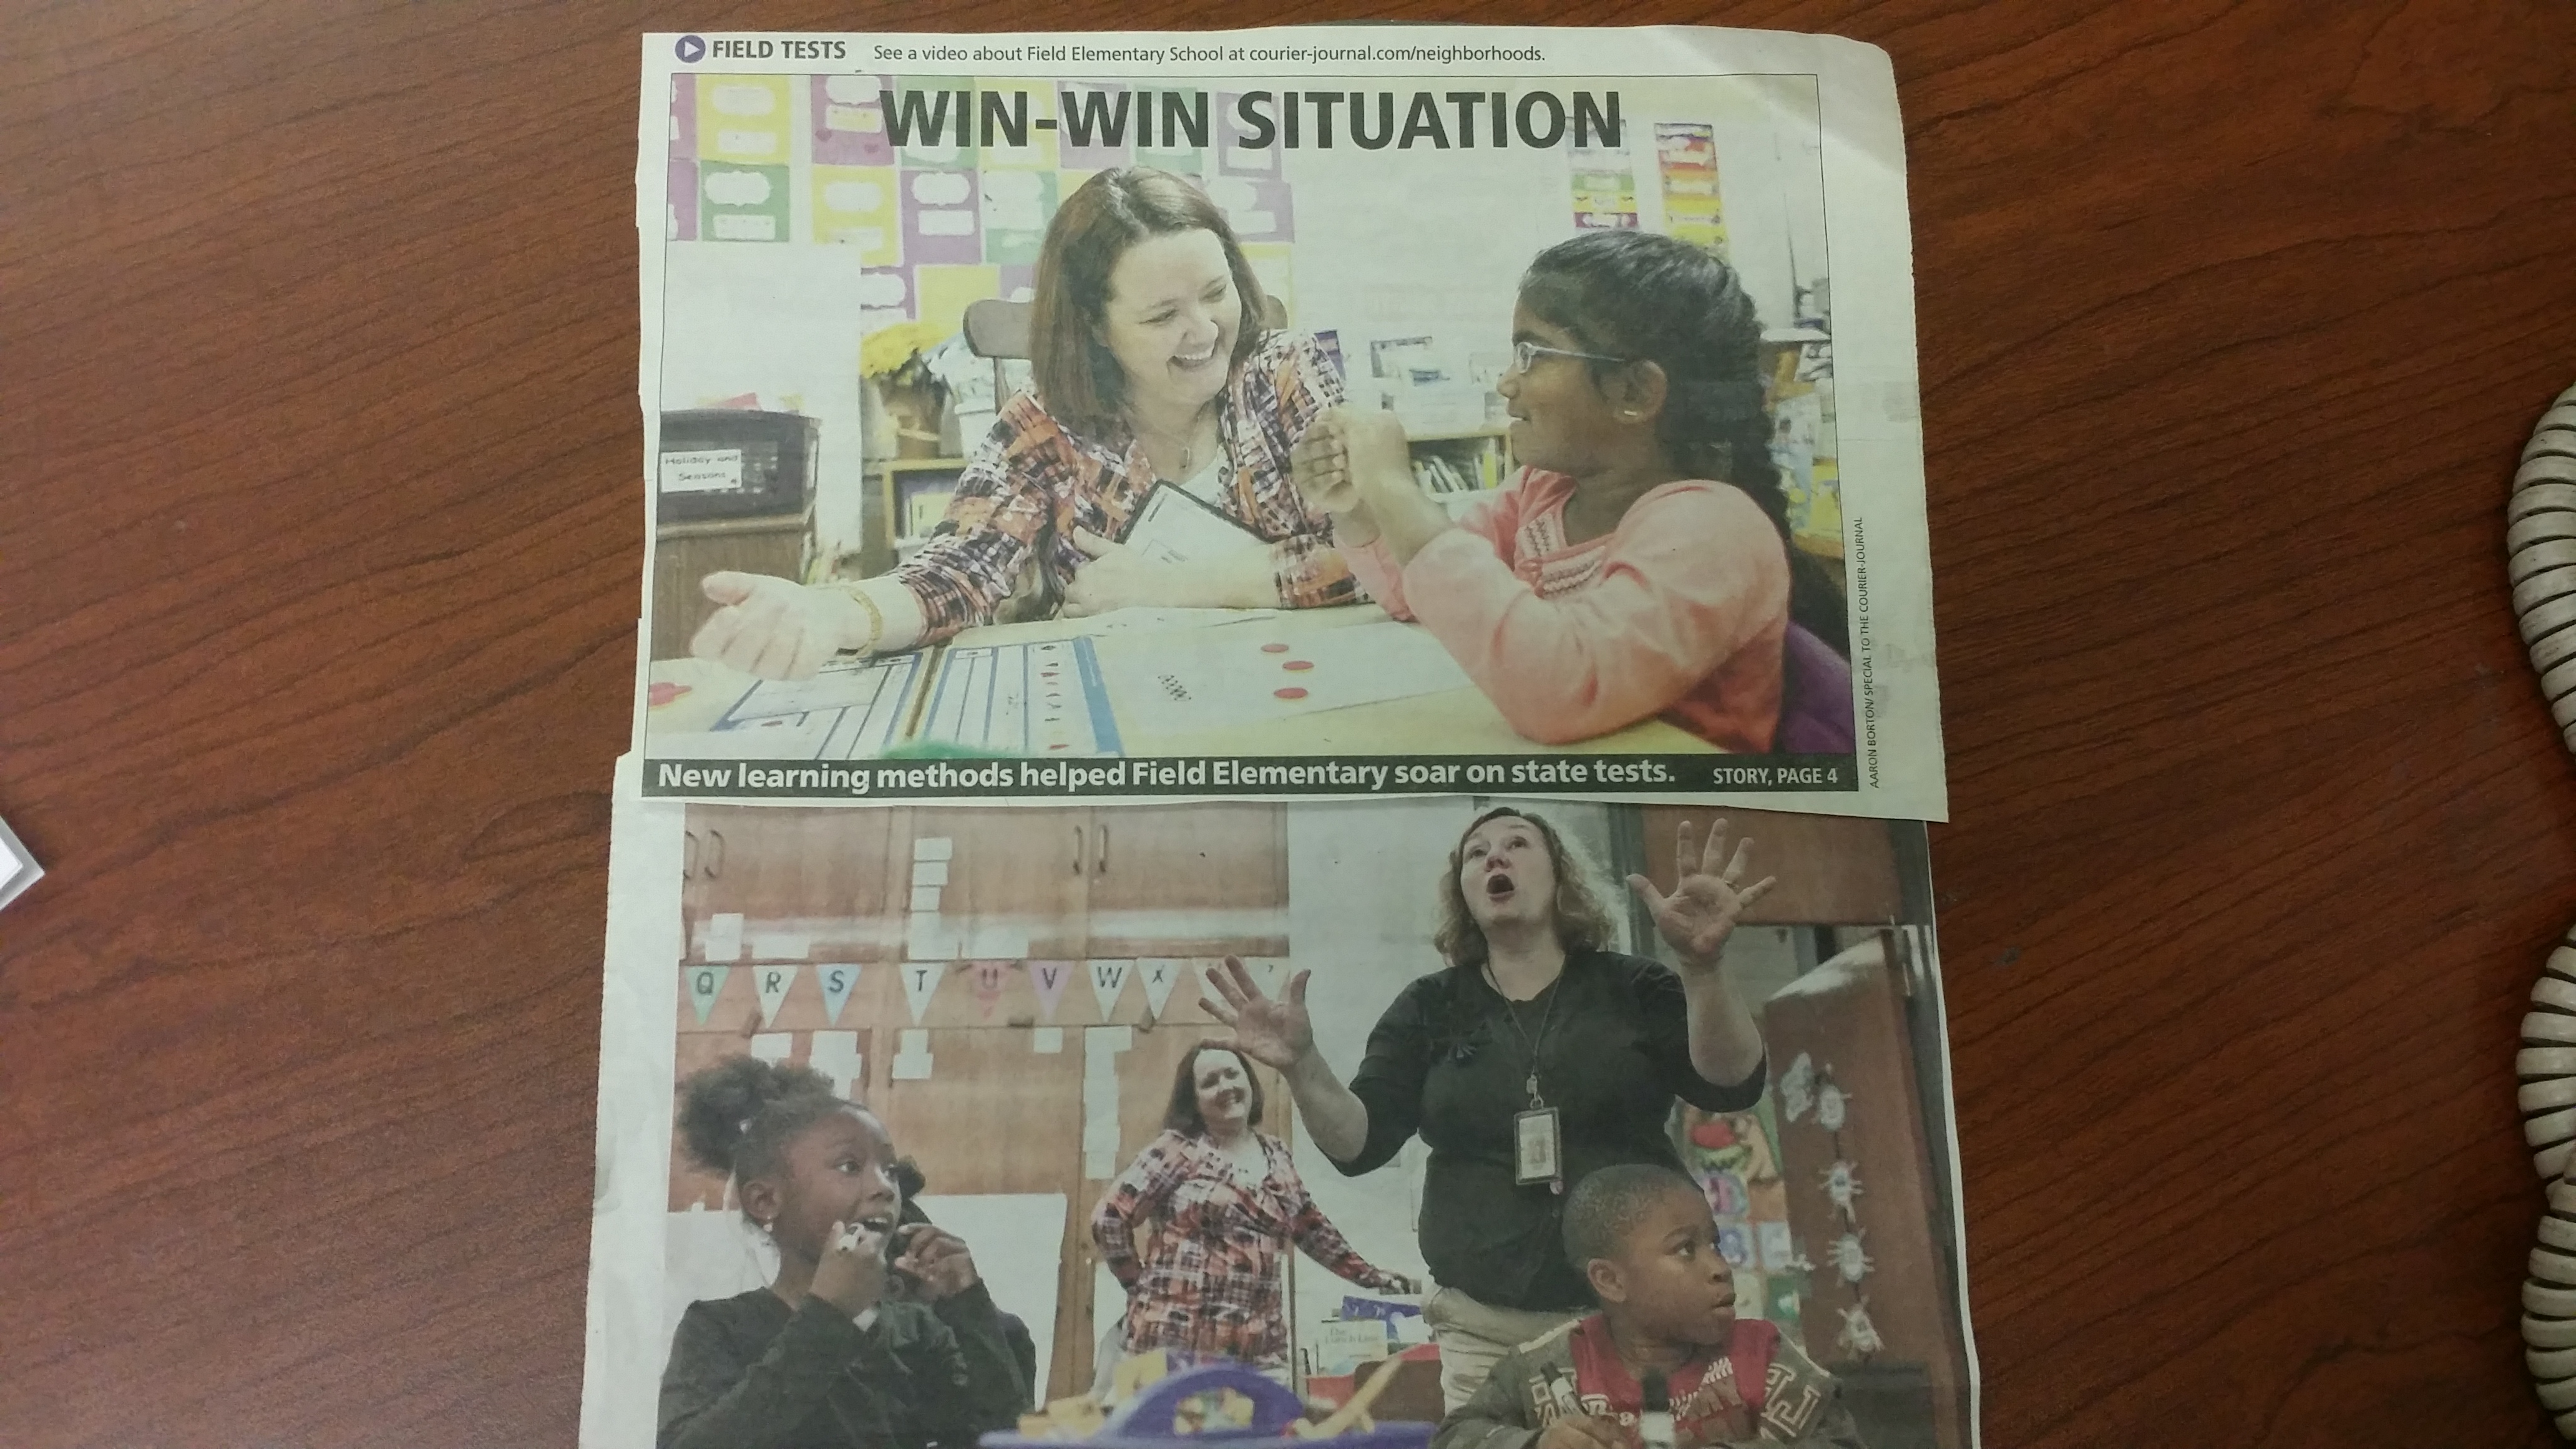
2014 Louisville Metro Council Proclamation for WIN Initiative