Keene Mill Elementary School
School Information
- School District: Fairfax County Public Schools
- School Address: 6310 Bardu Avenue , Springfield, VA 22152, US
- School Phone: 703.644.4700
- School Fax: 703.644.4795
- Principal: Renee Miller
- Contact E-Mail: rcmiller@fcps.edu
- Web Address: http://www.fcps.edu/KeeneMillES
Demographics
- Number of Students: 738
- Percent Eligible for Free and Reduced Lunch: 18.16%
- Percent of Limited English Proficient: 15.99%
- Percent of Special Education: 7.72%
Racial/Ethnic Percentages:
- White: 39.3%
- Black: 10.84%
- Hispanic: 21%
- Asian: 21.27%
- Native Hawaiian or Other Pacific Islander: 0%
- American Indian or Alaska Native: 0%
- Multiracial: 0%
- Other: 7.59%
“If teachers don’t see a compelling enough reason TO change, why would they care about WHAT or HOW to change?”
—Mike Mattos, co-author of Simplifying Response to Intervention
Keene Mill Elementary School failed to make Adequate Yearly Progress three out of four years from 2008 to 2011. In the fall of 2011, new principal Renee Miller knew that something had to change. That something was a culture of collaboration that would allow teachers the time and knowledge to get the hard work done.
That fall, teams learned what it meant to collaborate. Keene Mill teachers built a common understanding of what collaboration looked like and sounded like by participating in twice-weekly collaborative team meetings facilitated by the school administration. That first year, newly designated team leaders, instructional coaches, and administrators attended professional development together to build a shared understanding of the expectations for collaborative teams. Slowly, utilizing a model of gradual release, team leaders took on a more active role in the work of their team and the hard work of collaboration.
Some important steps along the way included creating a sense of urgency for supporting the neediest, most at-risk students, being clear with expectations on what was tight and what was loose, having administrators in the trenches with the teachers, (walking the talk!), and creating conditions that allowed for collaborative culture to grow.
Teams implemented collaborative practices such as curriculum mapping essential standards and creating student-friendly learning targets. Teachers included students in setting goals for learning and monitoring progress. Quarterly data days where assessment data was analyzed and disaggregated led to the team’s ability to name students by need for the purpose of intervention and enrichment across grade levels.
School leaders created conditions for ensuring all students had guaranteed access to essential learning by supporting teachers: shoring up the core through ensuring curriculum maps and observations during classroom walkthroughs were in alignment; creating a tiered system of interventions and enrichment provided opportunities for students to revisit critical content during a dedicated intervention block; and finally, a school wide intervention team to monitor the progress of the most at-risk students was created.
Through the last 3 years, the school has used all available data to inform next steps. Student achievement data from classroom, district, and state assessments allowed teams to continuously reflect on what supported success and identify areas for growth. Non-traditional sources of data, for instance, in the biannual working conditions survey, teachers’ professional development desires, and even principal evaluation surveys played a role in determining the needs of the school.
Most importantly, we believe in each other, our students, and having fun together!
1. Monitoring student learning on a timely basis.
The grade-level teams meet twice weekly during hour-long blocks of common planning time. The teams focus on either math or reading during these Collaborative Learning Team (CLT) meetings. It is through tightly structured agendas facilitated by team leaders that they focus on what students need to know and how will we know if they know it. Staff honor and value the use of data (both formal and informal) to guide their work. At the core of this is planning common assessments that meet the learning outcomes expressed during conversations when identifying student learning targets. Informal assessment includes information gathered by teachers through: anecdotal records, exit tickets, and high engagement strategies to gather student responses. Formal assessments, such as Horizon, DRA2 Progress Monitoring, Fountas & Pinnell Benchmark Assessment System, and other common summative assessments help teams learn together. Teachers routinely discuss student needs through weekly "kid talk." During this time students who have not met the expected benchmarks or learning outcomes are identified, and the team brainstorms additional strategies that may be successful to support student learning. Finally, each quarter, teams spend a day immersed in structured, deep data dialogue and analysis using district benchmark assessments in both reading and math. From this activity, students are identified by name and by need as a part of our ongoing cycle of instruction and placed into small intervention groups for either remediation or enrichment. Teachers collaboratively align strategies and resources to support the interventions.
2. Creating systems of intervention to provide students with additional time and support for learning.
The staff understands the multiple opportunities they have to provide intervention. First, the staff recognizes that by using Guided Reading and Guided Math approaches to instruction, intervention can be provided during the content area block of time. Next, special education teachers, ESOL teachers, and instructional assistants are used to “push in” support to provide scaffolding and small group instruction.
The Keene Mill master instructional schedule allows for 30-minute blocks of intervention or "JUMP START" at varying times throughout the day, which allows for specialists and other highly qualified staff to support students who need additional time and support with content. During this time, teachers meet with small groups or in conferences with individual students. Support staff meet with small groups on a regular basis to intervene with selected content. Additional opportunities are provided for students who benefit from enrichment through parent volunteer programs and Young Scholars.
For students who require additional time and support, beyond the JUMP START double dip, are provided access to the curriculum through intense, small-group instruction using research-based intervention and remediation resources such as Do The Math, Moving With Math, Leveled Literacy Intervention (LLI), Read Well, and Language! Students at Tier 3 are also invited to before-school programs such as Rise to Shine where they access individualized online resources, Writing Boot Camp, and Summer Extended Learning.
Our system and tiers of instruction are monitored monthly by a school wide intervention team comprised of administrators, instructional coaches, special education teachers, ESOL teachers, school counselors, psychologists, and social worker. This interdisciplinary team reviews the progress of each student and determines next steps. The team celebrates when students move from the Tier 3 list back to Tier 2.
3. Building teacher capacity to work as members of high performing collaborative teams that focus efforts on improved learning for all students.
Our collaborative community was born, and has grown and developed from structural and cognitive changes implemented and maintained over the years. The school’s master schedule provides teachers with five hours of common grade level planning time weekly, arranged to allow teams to collaborate and make instructional decisions that will support student learning. In the early stages of building Professional Learning Communities, two of these five hours were supported by the literacy and math coaches, the special education teachers, along with administration. The administration and coaches worked together to build the capacity of teachers around the significance of collaboration and its impact on student learning. In addition, the coaches supported teachers in the selection and implementation of best instructional practices to achieve high levels of student performance and love for learning.
Our school’s collaborative vision has grown to become imbedded in our beliefs and actions. Each team constructs a set of norms at the beginning of the year to facilitate their work together. These norms are revisited at the beginning of every collaborative team meeting which currently takes place once a week during common planning time. Teams follow a pre-planned agenda centered in the four questions of a PLC. Coaches work with teachers to plan high-leverage instruction, decide how to work together inside the classroom by either modeling lessons or co-teaching, and in selecting effective resources. Together, coaches and teachers, analyze data and reflect on practices to make decisions for future planning based on the needs of the student body and of individual students. Special Education teachers and ESOL teachers are another piece of the collaborative teams that help classroom teachers provide our neediest students with everything they need to access learning at all levels.
As part of our learning and growth-seeking community, we utilize resources to maintain a keen sense knowledge and practice:
- Building capacity in team leaders, coaches (CC, Dennis Sparks, Erik Jensen, Ann Delehant, retreat) and teams (adaptive schools)
- Math Workshop, academy courses
- 6+1, BAS, Lucy Caulkins
- TAR book studies, TLAC, Seven Strategies, Simplifying RTI
- Parent book study (Creating Innovators)
- Principles to Actions (NCTM)
Additional Achievement Data
Pass Percent School- All
|
Subject |
VDOE Accreditation Benchmark |
Pass Percent School Year 2013-2014 |
Pass Percent School Year 2014-2015 |
Pass Percent School Year 2015-2016 |
||||||
|
|
|
KMES |
FCPS |
VA |
KMES |
FCPS |
VA |
KMES |
FCPS |
VA |
|
English |
75 |
93 |
81 |
74 |
94 |
85 |
79 |
94 |
85 |
80 |
|
Math |
70 |
96 |
81 |
74 |
96 |
84 |
79 |
96 |
83 |
80 |
Pass Percent- 3rd Grade
|
Subject |
VDOE 2015-2016 Accreditation Benchmark |
Pass Percent School Year 2013-2014 |
Pass Percent School Year 2014-2015 |
Pass Percent School Year 2015-2016 |
||||||
|
|
|
KMES |
FCPS |
VA |
KMES |
FCPS |
VA |
KMES |
FCPS |
VA |
|
English |
75 |
86 |
74 |
69 |
92 |
81 |
75 |
93 |
81 |
76 |
|
Math |
70 |
93 |
70 |
67 |
92 |
77 |
74 |
93 |
78 |
77 |
Pass Percent- 4th Grade
|
Subject |
VDOE 2015-2016 Accreditation Benchmark |
Pass Percent School Year 2013-2014 |
Pass Percent School Year 2014-2015 |
Pass Percent School Year 2015-2016 |
||||||
|
|
|
KMES |
FCPS |
VA |
KMES |
FCPS |
VA |
KMES |
FCPS |
VA |
|
English |
75 |
95 |
75 |
70 |
92 |
82 |
77 |
97 |
80 |
77 |
|
Math |
70 |
97 |
83 |
80 |
97 |
85 |
84 |
99 |
83 |
83 |
Pass Percent- 5th Grade
|
Subject |
VDOE 2015-2016 Accreditation Benchmark |
Pass Percent School Year 2013-2014 |
Pass Percent School Year 2014-2015 |
Pass Percent School Year 2015-2016 |
||||||
|
|
|
KMES |
FCPS |
VA |
KMES |
FCPS |
VA |
KMES |
FCPS |
VA |
|
English |
75 |
95 |
79 |
73 |
96 |
84 |
79 |
95 |
85 |
81 |
|
Math |
70 |
88 |
74 |
73 |
91 |
75 |
79 |
91 |
76 |
79 |
Pass Percent- 6th Grade
|
Subject |
VDOE 2015-2016 Accreditation Benchmark |
Pass Percent School Year 2013-2014 |
Pass Percent School Year 2014-2015 |
Pass Percent School Year 2015-2016 |
||||||
|
|
|
KMES |
FCPS |
VA |
KMES |
FCPS |
VA |
KMES |
FCPS |
VA |
|
English |
75 |
94 |
82 |
73 |
94 |
85 |
76 |
91 |
85 |
77 |
|
Math |
70 |
98 |
88 |
76 |
98 |
91 |
83 |
95 |
90 |
82 |
|
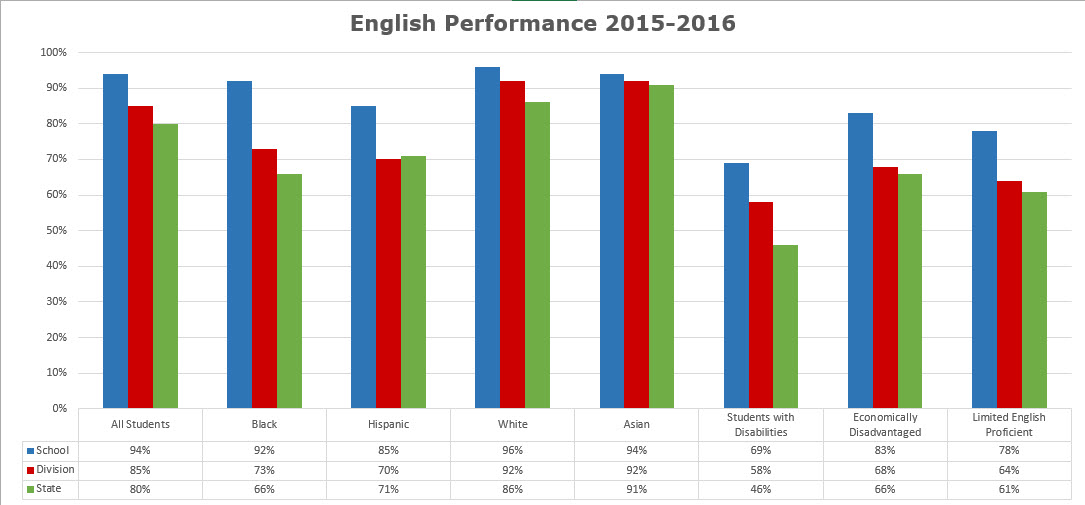
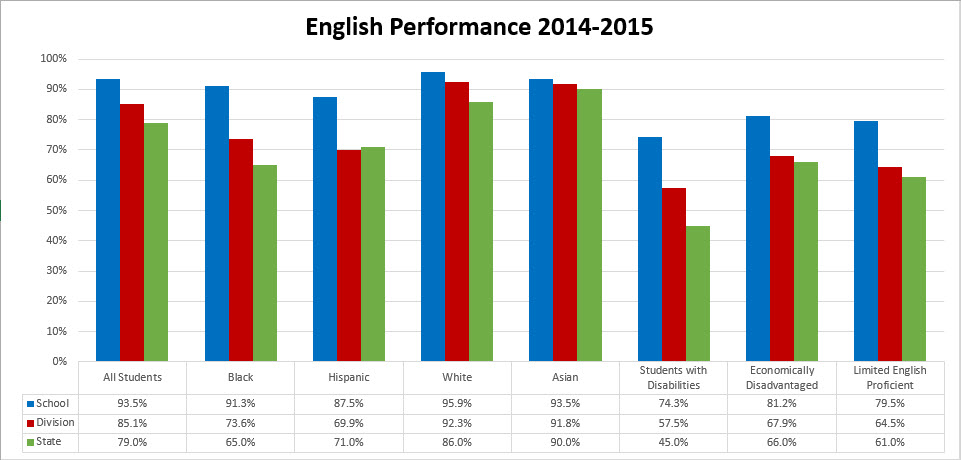
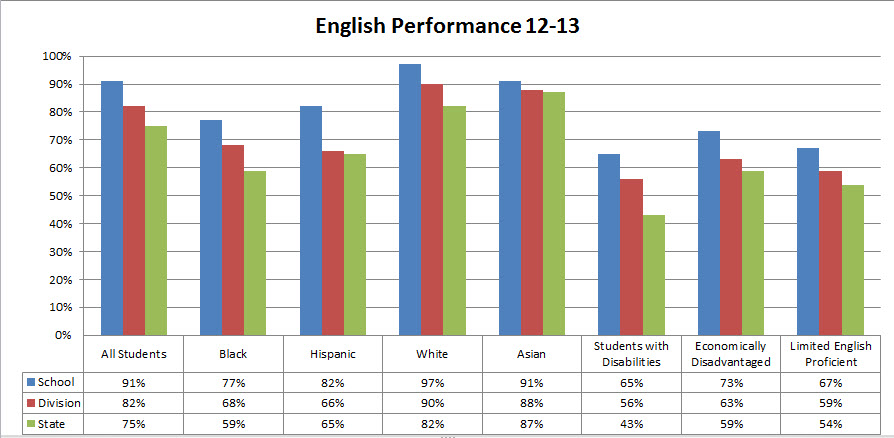
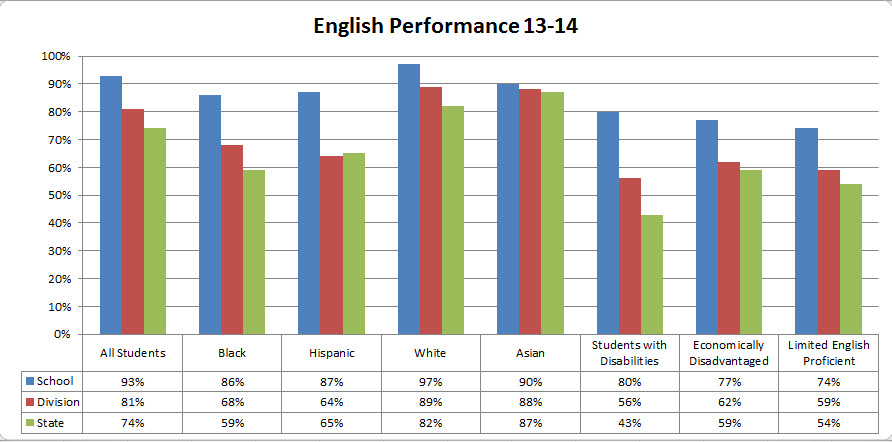
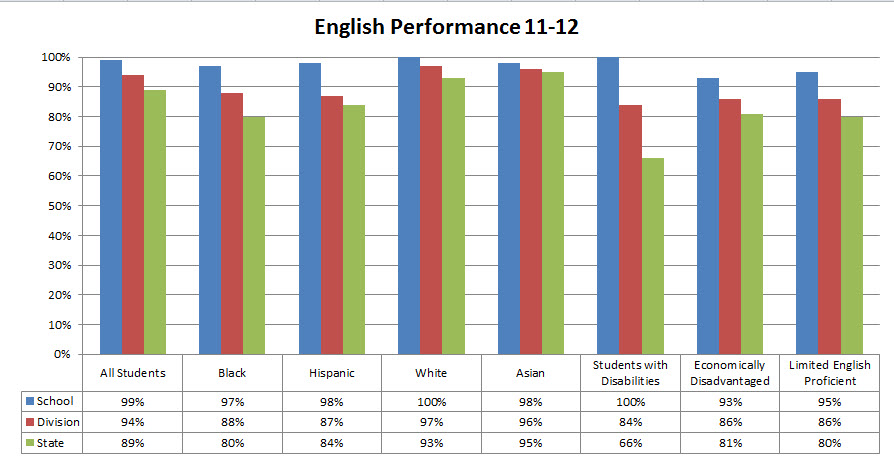
English Performance |
2013-2014 |
2014-2015 |
2015-2016 |
|
|
All Students |
School |
93% |
94% |
94% |
|
Division |
81% |
85% |
85% |
|
|
State |
74% |
79% |
80% |
|
|
Black |
School |
86% |
91% |
92% |
|
Division |
68% |
74% |
73% |
|
|
State |
59% |
65% |
66% |
|
|
Hispanic |
School |
87% |
88% |
85% |
|
Division |
64% |
70% |
70% |
|
|
State |
65% |
71% |
71% |
|
|
White |
School |
97% |
96% |
96% |
|
Division |
89% |
92% |
92% |
|
|
State |
82% |
86% |
86% |
|
|
Asian |
School |
90% |
94% |
94% |
|
Division |
88% |
92% |
92% |
|
|
State |
87% |
90% |
91% |
|
|
Students with Disabilities |
School |
80% |
74% |
69% |
|
Division |
56% |
58% |
58% |
|
|
State |
43% |
45% |
46% |
|
|
Economically Disadvantage |
School |
77% |
81% |
83% |
|
Division |
62% |
68% |
68% |
|
|
State |
59% |
66% |
66% |
|
|
Limited English Proficient |
School |
74% |
80% |
78% |
|
Division |
59% |
65% |
64% |
|
|
State |
54% |
61% |
61% |
|
|
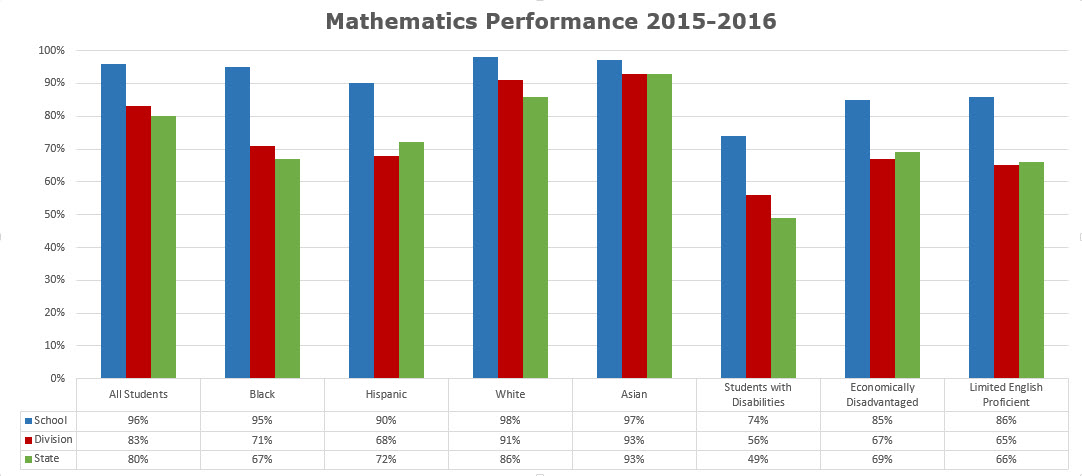
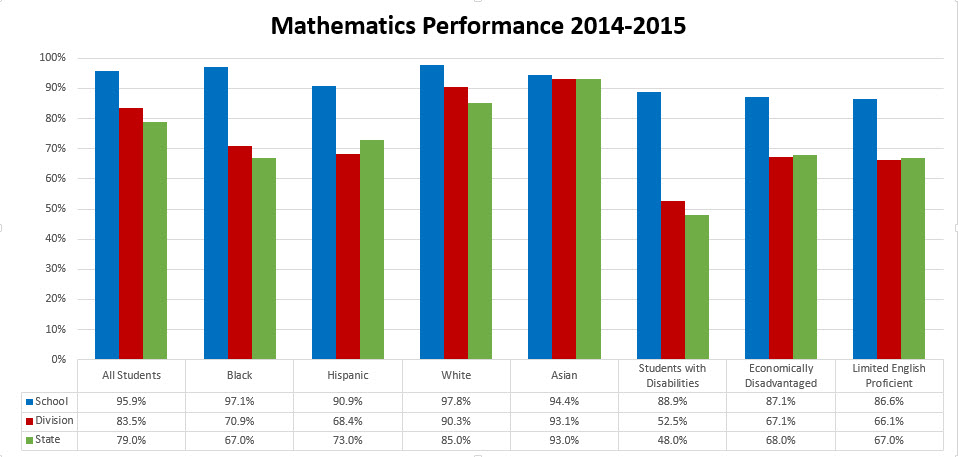
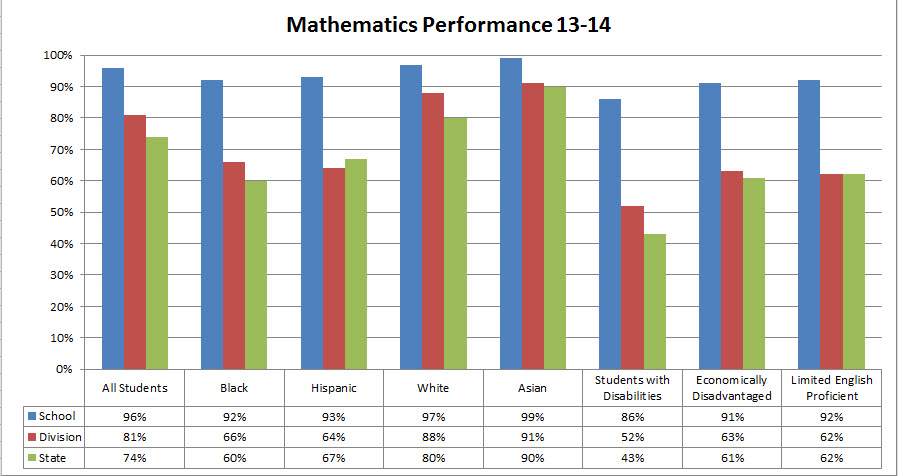
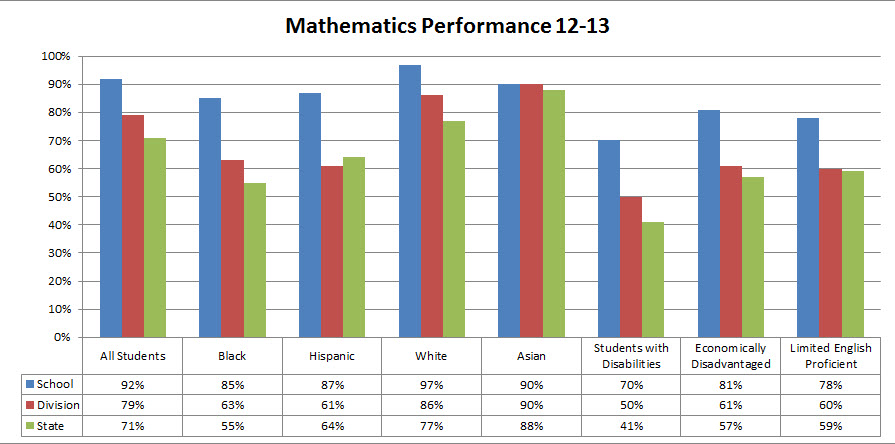
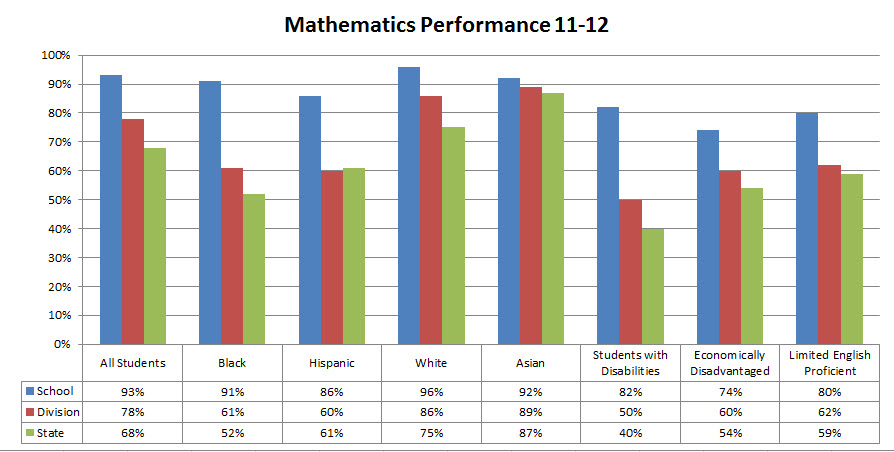
Math Performance |
2013-2014 |
2014-2015 |
2015-2016 |
|
|
All Students |
School |
96% |
96% |
96% |
|
Division |
81% |
84% |
83% |
|
|
State |
74% |
79% |
80% |
|
|
Black |
School |
92% |
97% |
95% |
|
Division |
66% |
71% |
71% |
|
|
State |
60% |
67% |
67% |
|
|
Hispanic |
School |
93% |
91% |
90% |
|
Division |
64% |
68% |
68% |
|
|
State |
67% |
73% |
72% |
|
|
White |
School |
97% |
98% |
98% |
|
Division |
88% |
90% |
91% |
|
|
State |
80% |
85% |
86% |
|
|
Asian |
School |
99% |
94% |
97% |
|
Division |
91% |
93% |
93% |
|
|
State |
90% |
93% |
93% |
|
|
Students with Disabilities |
School |
86% |
89% |
74% |
|
Division |
52% |
53% |
56% |
|
|
State |
43% |
48% |
49% |
|
|
Economically Disadvantage |
School |
91% |
87% |
85% |
|
Division |
63% |
67% |
67% |
|
|
State |
61% |
68% |
69% |
|
|
Limited English Proficient |
School |
92% |
87% |
86% |
|
Division |
62% |
66% |
65% |
|
|
State |
62% |
67% |
66% |
|
Spring 2016- State of Virginia Board of Education Distinguished Achievement Award
2014 & 2015 —State of Virginia Board of Education Excellence Award, a recognition of schools and divisions that have met all state and federal achievement benchmarks and have made significant progress toward goals for increased student achievement and expanded educational opportunities
2013—Northern Virginia Magazine Best Elementary School Award