Bernice Ayer Middle School (2024)
School Information
- School Address: 1271 Calle Sarmentoso , San Clemente, CA 92673, US
- School Phone: (949) 366-9607
- Principal: Nick Stever
- Contact E-Mail: NRSTEVER@capousd.org
- Web Address: http://bams.schoolloop.com
Demographics
- Number of Students: 863
- Percent Eligible for Free and Reduced Lunch: 20.2%
- Percent of Limited English Proficient: 13.44%
- Percent of Special Education: 10.42%
Racial/Ethnic Percentages:
- White: 55%
- Black: 0.1%
- Hispanic: 34.3%
- Asian: 4%
- Native Hawaiian or Other Pacific Islander: 0.1%
- American Indian or Alaska Native: 0.5%
- Multiracial: 6%
- Other: 0%
Our journey in becoming a Professional Learning Community (PLC) emerged five years ago with humble beginnings as our district identified Bernice Ayer Middle School (BAMS) as a target school to implement Multi-Tiered Systems of Support (MTSS) due to the lack of academic growth with specific student subgroups. This designation ignited our walk through the PLC process.
In order for our school site to come to a shared understanding of the work of a PLC, we began by investing time in creating shared learning experiences. We pursued opportunities to learn together by attending a PLC Institute every year, with a laser focus on obtaining specific information and research-based practices to further strengthen our collective understanding of the PLC process. Annually, groups of teachers and administrators returned from the conference, as a unified guiding coalition, leading the pathway for change with the rest of the staff.
Our inaugural team of teachers and administrators returned from the PLC conference with a clear vision of guiding our school site to a collective understanding of our purpose. A year-long journey of establishing shared learning experiences allowed our site to begin to form a centralized understanding of the PLC process and through that work, we were able to collectively form a mission statement.
In collaboratively creating and building consensus on our purpose, educators at BAMS committed to the fact that students’ ability to learn at high-levels rests on our shoulders and to accomplish that lofty goal, we must work collaboratively and interdependently with one another. To effectively work interdependently in upholding our responsibility to the academic success of ALL students, grade level and content teams received intense professional development on PLC concepts and embedded time within the school day to work with one another.
The collaborative time within the school day was formed through the use of common preps among grade levels and content teams, as well as late-starts every Tuesday, and numerous release days every year. To maximize the effectiveness of time allotted to collaborate, teacher teams created team norms that revolved around the common understanding that time given to work collectively is sacred. Simultaneously, administrators balanced this support with accountability by establishing both tight and loose expectations of the allotted collaborative time. Tight, being that teachers must work together and utilize their time addressing the academic needs of students, and loose, being the numerous aspects associated with the identification of standards and the creation of assessments.
With dedicated time in place, teacher teams began the process of prioritizing standards in answering the question of “what do we want every student to know and be able to do?” To accomplish this, teachers came to an agreement on standards that were absolutely a priority for all students to show proficiency, prior to entering the next grade level. Once teams determined priority standards, teachers then used their time to begin the important work of unwrapping priority standards and developing learning targets.
After collectively clarifying what students need to know, our site was ready to answer “how do we know if students have learned?” This involved professional development to support the creation of Common Formative Assessments (CFAs) as well as the skill of analyzing data. Protocols were created to provide support in both areas. As our teams grew in their ability to analyze data, this soon thrusted us into answering “what do we do when students haven’t learned and what do we do when they have learned?” Our school created a structured time within the school day to provide additional time and support to students who were struggling. This time was flexible and based on learning results. A shift from compliance to commitment, regarding the PLC process, emerged site-wide when teacher teams started to see improved learning results in students receiving intervention. Enrichment opportunities were also created for students who were excelling and ready to be pushed further.
To sustain this commitment, it has been an intentional focus of our school site to use research-based approaches for every aspect of our implementation of the PLC process. As a result, we turned to the work of Larry Ainsworth, Kim Bailey, Rick and Rebecca Dufour, Robert Marzano, Mike Mattos, and Anthony Muhammad to aid us in establishing unified processes to answer the four PLC questions.
1. Monitoring student learning on a timely basis.
There are several methodologies our school uses to continuously monitor student learning on a timely basis, however, as previously mentioned, the most vital is the use of Common Formative Assessments (CFA).
Upon the completion of a CFA, which is administered at least once a month per department, teacher teams reconvene to analyze the results of student performance. To drive the conversation in reviewing student scores, teams follow a structured data discussion protocol. The protocol highlights the determining factors of student success, the obstacles that prevented success, best teaching practices, and also clearly identifies which students need support through intervention during our School-Wide Educational Learning Lab (SWELL). Through disaggregating data from CFAs, teacher teams are able to identify trends in student achievement enabling them to make data-driven decisions on an ongoing, frequent, and timely basis. The purpose of the data discussion is to determine the best practices used by the team, share these practices, and implement them team-wide. Additionally, this process is a non-negotiable procedure in driving teams to make informed decisions about the next instructional steps. For instance, if a team has a significant number of students that miss a priority skill, the team will use this data to revisit the instructional techniques used. Learning, rather than teaching, becomes the focus when CFAs are used in conjunction with data discussions. The entire CFA process is a way we ensure our students have access to a viable and guaranteed curriculum.
The content and timing of when CFAs are administered is a loose component of the CFA process. However, a tight feature is that every team must agree to administer the same version of the test in the same way. For example, when a team builds a consensus to deliver a CFA “cold” it is understood that there will be no pre-teaching of the material. This creates “like” data that is valuable during analysis and allows teams to share best teaching practices and validate those practices with evidence.
Concurrently, analyzing student data from CFAs, teachers come together as grade-level teams to assess how students are performing across disciplines. This designated time allows teams to discuss student academic and social-emotional needs. The frequency of this embedded time within grade levels permits teams to catch discrepancies in student learning and provide appropriate intervention. Moreover, further analysis is conducted through Student Support Teams (SSTs). An SST is an added layer in how we continuously progress and monitor student learning at our school. SSTs consist of teachers and administrators who come together to discuss the academic needs of students and draft action-plans detailing the necessary support to overcome learning barriers.
2. Creating systems of intervention to provide students with additional time and support for learning.
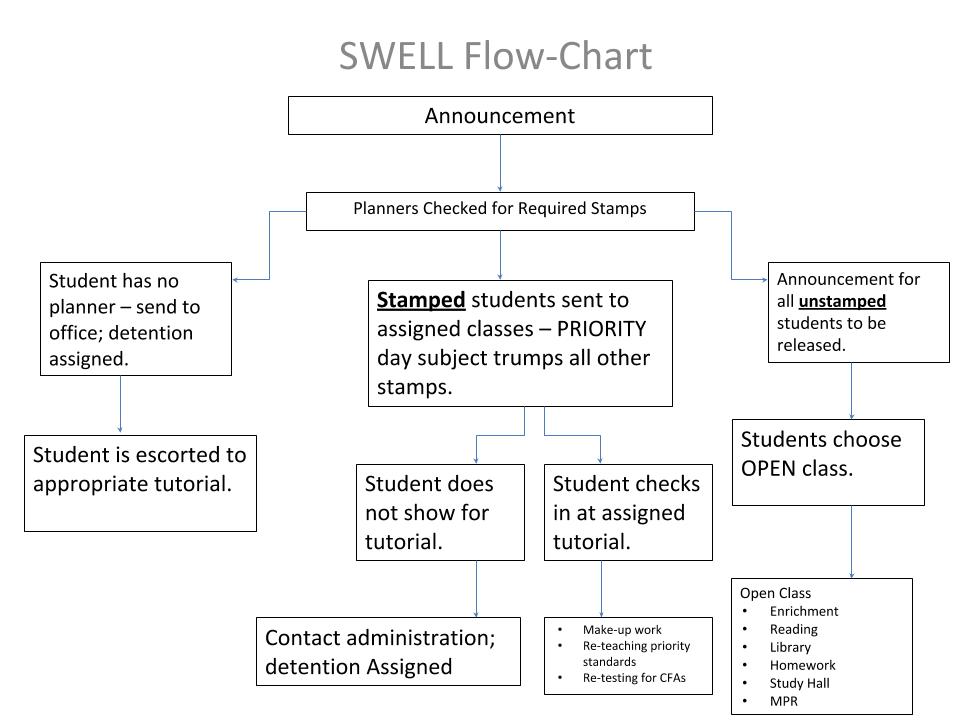
We encompass a multi-faceted progressive approach in how we implement and respond to student needs at BAMS. We react to students who exhibit a necessity for additional time and support within an intervention structure that resembles a pyramid. Knowing that the vast majority of student needs must be met within the classroom, our pyramid of intervention begins with great first instruction. As students demonstrate the need for intensified intervention, we have also created the School-Wide Educational Learning Lab (SWELL) which is a tier two intervention. Our data discussion protocol, completed after every CFA has been administered, helps our teams, direct students, into the most needed SWELL intervention classes.
SWELL is a thirty-minute block held every day with the purpose of supplying students who need it, with front-loading, re-teaching, and the opportunity to reassess on priority standards. The school week is compartmentalized into priority days with each content area receiving a day of priority. This means students that have been identified through CFA results requiring additional support receive a stamp on their school planner, directing them to attend an intervention. Stamped student attendance during SWELL is not an invitation but rather a mandate. Intervention classes during SWELL are strictly for students who have not achieved proficiency on priority standards, yet. Additionally, intervention classes are primarily taught by content teachers who receive the highest level of proficiency in their teams’ CFA results. Allowing another teacher to take the reins on re-teaching students, was not something that came naturally but has demonstrated the fact that these are all of our students. Teacher teams have formed an unprecedented amount of respect, trust, and vulnerability within their teams to make this system effective.
Our SWELL schedule also provides us the provision to answer the question, “what do we do when students have learned?” as students who are not stamped are open to exploring enrichment classes. The enrichment courses serve to further ignite students' intellectual curiosity and sharpen academic skill sets. Examples of our enrichment sections during SWELL include creative writing, coding, art, music, and science STEM activities.
Understanding that thirty minutes a day may not be enough to fulfill our students’ needs in scoring proficiently on priority standards, we also provide intervention courses that are a part of a students’ daily schedule and are considered tier three interventions. We believe that students are capable of earning proficiency on priority standards so our intervention courses are scheduled at the same time as electives, allowing students to fluidly move in and out of support classes as demonstrated by data. These classes focus on building foundational math skills, literacy skills, study skills, and social and emotional well being.
SWELL and our intervention courses are a direct result of our firm belief that a student's academic performance is our responsibility and we are ultimately responsible for their success.
3. Building teacher capacity to work as members of high performing collaborative teams that focus efforts on improved learning for all students.
We maintain our ability to work as a high-performing collaborative team by continuously making decisions aligned with the four PLC questions. Additionally, we have rearranged our policies, practices, and procedures to align with our mission, allowing us not to deviate from it nor take seductive shortcuts in fulfilling it.
Schoolwide, we begin each year by collaborating to develop common goals that guide our continued learning as high performing teams. From establishing agreed-upon goals, we then move to produce genuine shared learning experiences. In these experiences, we engage in intense research and the studying of evidence-based practices associated with our common goals. The analysis of this information amongst teacher teams orchestrates a collective factual understanding of which evidence-based practices are proven effective in enhancing student learning. We utilize our norms in building consensus on how we will incorporate evidence-based philosophies at our site because we understand that executing a plan to use these research-supported strategies will be challenging and our established norms direct us in navigating disagreements.
As high performing teams, we participate in cycles of action research identifying best practices. Teacher teams first look within their own teams for proven resources that promote student learning. After teacher teams apply a specific strategy, the strategy is always assessed for its effectiveness and teams decide whether the strategy employed was beneficial for students or not. When we determine that a strategy is successful, teachers make a commitment to one another to implement that strategy. Additionally, when teams analyze common formative assessment (CFA) data and see that a team member is gifted in a specific area, that colleague is relied on in sharing their expertise with the team.
Alternatively, when teams assess that the most effective teaching strategy is not amongst them, professional inquiry outside of our school is initiated. In our professional inquiries as a site, we have studied the work of Robert Marzano, Dr. Kate Kinsella, Douglass Fisher, Lori Olsen, and Thomas Guskey. After studying leaders in the field, guiding coalitions are formed that are teacher-led and supported by administration. Our guiding coalitions are composed, not only of teachers and administrators from our school, but of other experts within our district and state, encompassing a wide perspective in leading BAMS in implementing processes that will improve student learning. An example of a highly successful guided coalition is the one formed in response to our English Language Learners when our data revealed a lack of growth. Another example is our guiding coalition established for grading practices because as a high performing team we recognized that there was inequity distributed in our grading practices.
This cycle of learning is continuous and is implemented at every level within our professional learning community from grade-level teams, to content teams, to support staff. We remain relentless in our pursuit of improved student learning and heavily rely on guiding coalitions to support this work.
Achievement Data Files
- plc-2019-2020-data-_visuals.pdf
- 21-23--3-year-comparable-data-3371.pdf
- 21-23--data-highlights.pdf
- 4-yearcomaparabledata_plc.pdf
- bams-eoe-plc-revised.xlsx
- bams-growth_plc.xlsx
Additional Achievement Data
The BAMS PLC has shifted in seeing data in the words of Anthony Muhammad “as information and not condemnation.” As a direct correlation in adopting this perspective, our students’ data drives, and affirms the decisions we make, emulating our mission of taking responsibility that all students will achieve at high levels.
The California Assessment of Student Progress and Performance (CAASPP) was established in 2014 and replaced California’s Standardized Testing and Reporting (STAR) assessment. The CAASPP is a summative assessment aligned to common core standards and is administered at the end of the academic school year. The results of CAASPP allow teachers, administrators, students, parents, and other stakeholders to evaluate learning.
When analyzing our students’ performance on high-stakes testing such as the CAASPP, we disaggregate the data to assess growth versus achievement growth. The CAASPP is measured on a sliding scale, with an expected annual average growth scale of 20 points. Any growth greater than the expected 20 points is evidence of significant achievement, however, in some cases, students will need to grow 50 to 70 points to move a single performance band. In extreme cases, students can grow upwards of 200 points and still not meet the “Standard Met” performance band as measured by CAASPP. At BAMS, we uncovered by measuring student Distance From Met (DFM) scores, that we had entire grade levels growing over 20 points in one academic school year. For instance, our 7th graders grew an average of 35 points beyond the state expectation for one year of growth in English. Furthermore, our English Language Learners grew an astounding 26 points in English, one of the highest levels of growth in our district. There are many academic areas in which BAMS leads our district in DFM on the SBA. Collectively as a school, in 2019 our students grew an average of 17 points in English and 9 points in math after three years of PLC implementation.
Celebrations are a key component in sustaining a healthy culture at BAMS. We celebrate student growth at all levels because it is the tangible evidence that we are meeting our Mission. Through the lens of viewing data by growth and not just overall performance, we have witnessed a direct connection between student ongoing growth on CFAs and their academic achievement on high-stakes assessments.
The state of California monitors school achievement by assigning schools and students a color-coded performance level of red, orange, yellow, green, and blue (blue representing the highest) on the California School Dashboard. Overall, students at BAMS performed at high levels in both mathematics and English in the year 2018 and 2019. In mathematics, students performed at the second-highest level of green, and in English, students achieved the highest level of blue. The California School Dashboard reflects current and prior years' progress. BAMS’s overall student performance for English has remained above the state standard consistently for three straight years. In the area of mathematics, students have been consistent in meeting the standard. Our English Language Learners (ELLs)are not excluded in the growth we have seen among our students, 44.4% of our ELL students have grown at least one English Language Proficiency level. Additionally, our collective English Language Learners population has demonstrated an average of more than a year's growth on the SBA.
The results of the past three years demonstrate that BAMS students have been able to make significant, sustained, and continuous growth. At BAMS we are intentional in how we look at student performance data in correlation to achievement. By doing so, we witnessed that when students consistently made large gains, it was in direct connection to substantial student achievement growth due to our active commitment to the PLC process. Sustaining ongoing growth for our students is non-negotiable in guaranteeing they are capable of learning at high levels and our curriculum is viable and guaranteed.
We set a precedent for evaluating our data in terms of grade level and content cohorts and have seen growth. Though it became essential to go more in-depth and process whether there were pockets of individual students, who for example, transferred to us from a neighboring school and or joined our school mid-year if they too were growing. BAMS is an outlier and a trailblazer in the district of Capistrano Unified in that we have become the only school in our district to have PLC teams analyze how much students grew from the time they entered their class to the time that they leave. The traditional way of looking at data at most schools is looking at achievement data by grade level and holistically comparing an entire grade to how that grade did in the previous year and how students in that grade scored across the district and state. Looking at data in this way gives us a limited scope on student performance because we are comparing data from two different groups of students rather than looking at how a cohort of students progresses in their achievement over their time with us. In addition at BAMS, we traditionally evaluate using the cohort model to compare how student sub-groups are progressing and even more so we compare cohorts as they progress through their time with us. For example, we contrast how 6th graders come to us, to how they do as 7th graders to determine if our practices are yielding substantial improvement as measured by overall achievement scores. Tracking the cohort growth of students as they promote gave us insight into students growing but it did not fully capture the individual student wins that we were experiencing at the classroom level. Furthermore, we wanted to pinpoint where the gains in overall achievement were coming from with the intent to replicate it school-wide. Thus causing us to take a deeper look specifically delving into individual student scores.
In doing so we found subgroups of students who grew an upward of two hundred plus points, which is the equivalent of growing multiple years academically within a one-year time frame.
In understanding that students were making substantial growth yet still not crossing the performance band of standards met as a site, we went on a professional inquiry that shifted away from solely finding validation in our work from overall achievement scores because we came to an understanding that there are students who come to us at different educational learning points and there are educators within our PLC who were obtaining higher levels of growth that were not reciprocated in achievement scores.
The shift in valuing growth data over achievement data provided us with the catalyst necessary to look within our PLC to study and seek to replicate the instructional practices that were being used in the classes that were showing the highest levels of growth rather than only looking at the highest scores.
As a PLC we also investigated through academic queries what still needed to be done to answer why students were not moving a performance band. Through this process of analyzing growth data, we observed a trend that suggested that some subgroups were growing at a rapid rate, but not making headway in increasing achievement scores. One specific subgroup that had made significant growth that did not translate into bumps in achievement data was our English Learner population.
Many of our incoming students have high levels of language deficiencies due to being in a dual immersion program or coming in as ELs. It has been tracked and observed that a majority over 90 percent of our EL students enter our school with language deficiencies due to spending their primary years of school in a dual immersion program where they operate on a continuum of not even spending fifty percent of their day in English. Through our in-depth analysis of data and engaging in the data discussion protocol we were able to identify the obstacles and successes that individual teachers had experienced in teaching EL students. We used this discussion coupled with the evidence that some teachers were experiencing success to replicate the best practices that were identified to work with these students. Had we relied solely on achievement data to facilitate this discussion we would have missed out on tapping into the teachers within our own PLC who had clearly demonstrated success with this demographic of students.
In fully understanding our students’ needs we responded in multiple ways. One way was looking inside our own PLC for the strategies that moved our most vulnerable subgroups. Another was when those pedagogy models were implemented and it still wasn’t enough to look at research and from a guiding coalition tasked with learning together, analyzing data, facing brutal facts, and deriving an action plan which birthed Collaboratively Raising Every Student’s Talents (CREST).
CREST is a site program that focuses specifically on building academic language and literacy skills for all students involved. All CREST teachers have made collective commitments to implement research-based instructional routines on a daily basis. These routines were selected based on recommendations made by the guiding coalition that had engaged in a rigorous study of professionals such as Dr. Kate Kinsella and Robert Marzano. While still in the infancy of implementation, there has been evidence of success for students in the program. For instance, our site scores on District benchmarks such as Document Based Questions (DBQ) and Common Interim Assessments (CIA) which measures students ability to read and analyze texts to answer an argumentative prompt have risen to become the highest scores in the District compared to recent years scoring in the bottom percentile of schools.
A founding principle of the PLC process is continuous growth. We honor this by focusing on growth as a component at every level within our PLC.
At the school site level, we annually set a vision by curating goals to confront our brutal facts and are aligned to meet the components of our mission that we have not met, equating to constant reflection and a focus on results. From the site level being committed to ongoing growth teacher teams exemplify their promise to growth by collaborating on best practices to continually strengthen CFAs. This has lead to numerous transformations across our school from increased student achievement scores to change in staff and school culture. The rate of our school suspensions has declined drastically in direct correlation to our commitment to growth and the PLC work. For example, from 2016 to 2019 our suspension rate dropped from 7 percent (2016) to 3.5 percent (2019) delving deeper into subgroups our English Learners went from 14.1 percent (2016) to 9.7 percent (2019) and our student with disabilities declined from 15.6 percent (2016) to 8.9 percent (2019).
The harvest of our continuous labor has earned us recognition in being awarded a School to Watch, California Distinguished School, and Positive Behavioral Intervention Supports (PBIS) Platinum level recipient. Our school continues to embody the components of the PLC at work methodology in understanding that there is no finish line and that the work required to meet our students’ needs is ongoing. Furthermore, it must be met through the cycle of utilizing best practices within teams, facilitating professional inquiries, and facilitating action research when our strategies are not yielding the best results. The PLC framework allows us to continually fulfill our mission and vision.
2019-2020 Data Narrative
Our students did not participate in state testing for the 2019-2020 school year due to COVID-19, and yet, from our regularly monitored benchmark assessments, students made outstanding gains in writing and math. In addition, our subpopulation of English Language Learners grew astronomically on benchmark assessments and was projected to replicate that same level of growth on state assessments.
Results from our benchmark data are derived from the Common Interim Assessment (CIA), a district created exam to evaluate students’ level of proficiency in argumentative writing and responding to a document-based question (DBQ). The CIA is administered three times a year, fall, winter, and spring, for grades 6th through 8th. Prior to moving to distance learning as a response to COVID, our students’ mid-year CIA scores for argumentative writing became the second-highest in the district, out of 12 middle schools and 12,970 total middle school students. This was historic considering in the 2017-2018 school year our students’ scores were ranked 9th, and in 2018-2019 our scores were 7th of all middle schools in the district. Similarly to the progress made in argumentative writing, our benchmark data for DBQs became the highest scores across the district in fall 2019. Comparatively, in math, we grew our number of proficiency from being the second-lowest middle school in the district to being ranked 8th.
Along with seeing substantial growth in literacy from the overall student population, English Language Learners (ELL) grew an outstanding 1300%. As a school, we went from having a single ELL student making dramatic gains in their reading and writing development to have 13 students show proficiency. Additionally, based on the data, we projected that 20 ELL students would score proficient on the 2020 spring district CIA had it occurred. This also would have meant that 40 of our ELL students would have crossed a performance band on the CIA. Our ELLs' growth in literacy was analogous to the development we observed in their mathematical skills as ELL students grew their proficiency by 1600% in 8th grade, 1500% in 7th grade, and 2500% in 6th grade on district benchmark assessments. The connection to the consequential growth from our ELL students comes from our commitment to an initiative we launched during the 2019-2020 school called CREST, standing for Collaboratively Raising Every Student’s Talents. CREST classes were comprised of a 50/50 model where 50% of the students were classified ELL and the other 50% were strong native English speakers. In these classes, teachers focused on strategically growing ELL students' literacy by emphasizing the practice of content objectives, language objectives, and academic discussions, allowing our ELL students to be exposed in every class period to exemplary modeling of the English language. With this model in place for three-fourths of the school year, we were elated to see the progression ELL students were making and projected to make on the state assessment.
The 2019-2020 academic school year proved to be unprecedented in regard to unforeseen challenges and obstacles faced to teach our students. However, the impact of the COVID-19 pandemic did not alter our belief in our mission that as a staff it is our responsibility to ensure the academic, social, and emotional growth of all students.
Our longitudinal four-year data is reflective of our students’ progression towards proficiency on high stakes testing and is inclusive of the peaks and valleys of our journey. In those four years, there are twenty-four measures assessed by the state, and those measures are comprised of our overall student performance in English and Mathematics as well as the percentage of students meeting or exceeding state standards that are classified as English Language Learners (EL), Special Education, and economically disadvantaged. Out of those twenty-four measures, we grew in eighteen of them, totaling seventy-five percent growth. Additionally, in the four-year comparison, we only declined in three areas.
Although as a school site, we were ecstatic about the transformational growth our students were exhibiting over the course of four years, we were concerned about the lack of growth from our EL students. Even with the understanding that some of our EL students were being re-classified, the lack of progression from this subgroup called us into action. As a site, we have spent the last two years on a voyage of action research studying best practices and researching models for our EL students. Through this cycle of inquiry emerged our CREST academy which stands for Collaboratively Raising Every Student’s Talents. The creation of CREST was our school’s response to our EL students’ lack of growth. Our CREST classes implemented daily academic conversations into every core content area but what makes this program unique and effective is that CREST classes are comprised of fifty percent ELL students and fifty percent of our model native English speakers which increased our EL students’ exposure to the English language daily.
Early district benchmark indicators from the 2019-2020 school year show that the implementation of CREST was yielding great success for our EL students. Specifically, we saw double the amount of growth from our EL students when compared to our entire student population on the district argumentative writing benchmark assessment and nine times the growth from EL students when compared to the entire school population on the district’s math benchmark assessment. Had we been allowed to participate in 2020 state testing, we are confident that our EL students would’ve produced tremendous results.
We value the information that overall student growth gives us, however, what takes more precedent for us as a school site, is analyzing and desegregating the data from student cohorts. Evaluating the data from student cohorts allows us to study the performance of a single class from the time they enter our school as sixth graders, to the time they leave us to attend high school. For instance, we see cohort growth when we look at our sixth graders’ English and Math scores from the 2017-2018 school year compared to how they did as seventh graders in 2018-2019. With just one year at our school, this cohort of students grew 13.62 points in English, and 1.61 points in Math. In addition, there was also growth from this same group of students in our subpopulations. For example, in English SPED increased by 8.77 points, economically disadvantaged students grew by 24.63 points, and ELL grew by 0.91. Comparatively in Math SPED grew 8.76 points and our economically disadvantaged grew 3.75 points. This representation of data allows us to appropriately make instructional decisions to further support the progression of our students and fulfill our mission.
2021-2023 Update
Math Data:
In order to track student progress in math and English our school district progress monitors our students at the beginning, middle and end of the school year by administering iReady and SBAC standards based assessments. By the middle of the 2022-2023 school year our school was 2nd in our district in terms of the growth and jumped one spot in overall achievement for the district ranking. Based on the students' performance on the end of year state SBAC assessment, BAMS topped the entire district in growth by a large margin and moved up another spot in overall achievement.
ELA Data:
In the 2021-22 school year BAMS students performed 3rd highest in the district in writing according to the state SBAC assessment and the following school year placed number 3 for growth in reading.
Science Data:
In the 2022 state science exam (CAST), BAMS placed fifth in the district in overall achievement and the following year in 2023 BAMS moved into 3rd place. In Both 2022 and 2023 BAMS SPED students topped the district in performance on the science exam.
ELD Data:
In 2022 English language learners meeting proficient on the State English language arts exam dwarfed our 5 year average. In 2023 English language learners at BAMS performed in the top three on the English language proficiency exam (ELPAC) for overall performance, oral language performance and writing performance.
Dual Immersion Data:
Dual immersion students at BAMS topped the district in scoring in the high band on the California Spanish Assessment.
California School to Watch: 2017-2018
California Distinguished School: 2018- 2019
Positive Behavioral Intervention Supports (PBIS) Platinum level: 2019-2020
California Pivotal Practice Award / California Department of Education / 2021 - 2022
Golden Bell Awards for an Outstanding Program - English Learner & Biliteracy / California School Boards Association / 2022 - 2023
Images
Files
- bams-swell-presentation.pdf
- 6-team-data.pdf
- 7-data-discussion-protocol-form.pdf
- unwrapping-graphic-organizer.pdf
- cfa-planning-guide.pdf
- _priority-standards-template-1.pdf
- _department-team-norms-docx.pdf
- plc-collaborative_academic-conversation-protocol.pdf
- plc-copy-of-data-discussion-protocol-directions.pdf
- plc-copy-of-cfa-timeline-6th-grade-english-2019.pdf
- plc-copy-of-swell-schedule--sheet1.pdf
- plc-flow-chart-7868.pdf